Don’t Miss Out On These 4 Amazing Tips from Facebook Analytics
You’ve launched a Facebook ad but those terms and numbers make no sense to you. Then comes Facebook analytics: Facebook analytics is powerful as it helps you understand your end-user better when it comes to how they interact with ads. It is a must-have for those spending money on ads and are aiming to achieve conversational results.
#1st Tips: What are Facebook custom columns?
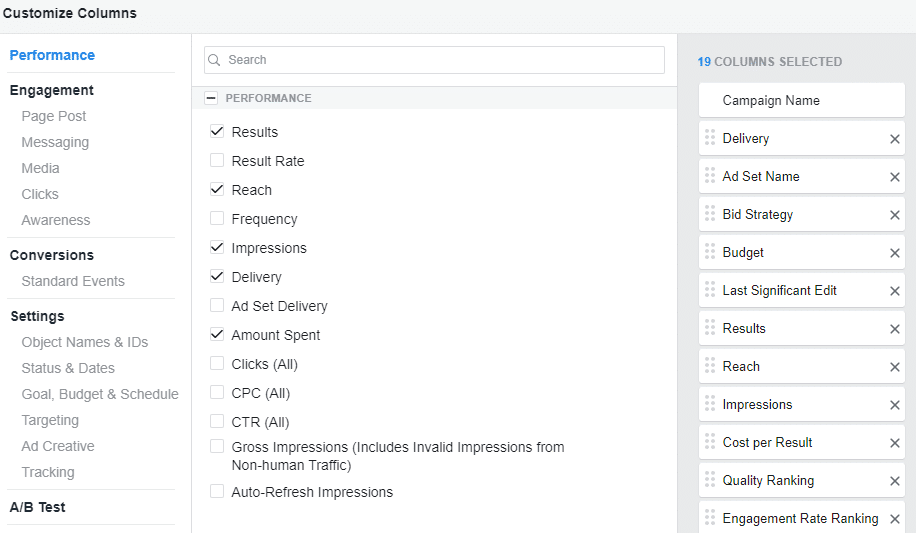
The first step in analyzing the results is to create a custom report. To create your custom report, go to your ads manager, press columns, and then customize columns. On the right, you will see the columns that are in your report. They are listed from top to bottom as they appear from left to right in your report. You can click X to eliminate the column that you don’t want to appear. You can also reorder them by clicking the six dots on the left and dragging the title around. In the middle section, you can select and deselect the columns for the report.
In the performance section, in the first column, we will select the amount spent. In the same section, also tick on frequency, clicks and CTR. Frequency tells you the average number of times each person saw your ad. Clicks is the number of clicks on your ad and CTR stands for clickthrough rate, it is the percentage of times people saw your ad and clicked on it. Now, click the conversion section on the left, you can tick on add to cart, checkout initiated, purchases. You can also check the number of content views associated with the ad and how much it cost for one content view. Click apply when everything looks good.
#2nd Tips: Understand the definition of the keywords
How is the performance of ads judged?
1) Ad Frequency
Facebook lets you know the average number of times people will see your ads. The standard amount is 1 for a new Facebook ads account but as you scale your Facebook ads effort, this number might increase. If your overall ad performance decreases despite an increase in ad frequency, it could be a sign that your audience is so used to your ads that they are starting to ignore it. If this is the case, modify your ads’ copy and graphics (overall creativity) to catch your audience’s attention again.
2) Clicks and clickthrough rate
The number of clicks you get depend heavily on the videos or images incorporated in your ads. In addition, your ad budget has an impact on your total number of clicks: If you spend more money, you are more likely to get more clicks.
The clickthrough rate is the number of times people saw your ad and clicked (in percentage). When the clickthrough rate is over 3%, you can consider your ad effective. To put it simply, the clickthrough rate tells you your ads are doing good by targeting the right audience and prompting them to click. However, in some cases, the clickthrough rate is low but the add to cart amount looks good. In such cases, there’s nothing to worry about.
3) Bounce rate
Bounce rate is calculated by dividing content views by ad clicks. The ideal bounce rate should be below 50% but if your online business is new, a bounce rate slightly higher than 50% is considered acceptable.
4) Cost per content view
As for the cost per content view, the lower the number, the better. Generally, the acceptable conversion rate is 2 sales for every 100 store visitors. Did you know? The 2% conversion rate is the average ecommerce conversion rate.
5) Add to cart and check out
During the add-to-cart and check-out process, a person may abandon their cart and not ever check out. Store analytics will inform you of this before you start a new campaign so that you can make necessary adjustments to your strategy or content.
#3rd Tip: Facebook Metrics Worth Knowing
- ROAS –Return On Ad Spend
The ROAS is the total revenue generated from your ads divided by the total ad spend and indicates how profitable your ads are. The rest of your variable expenses is included when calculating your ROAS.
- Purchase Conversion Value
Purchase conversion value is your total revenue generated from Facebook ads. To calculate the purchase conversion value, take the number of items sold and multiply it by the individual cost of those items.
- Cost Per Purchase
Typically, Facebook calculates it for us automatically. Cost Per Purchase is a great way to gauge if your advertising is selling products at a profit or at a loss. Calculate Cost Per Purchase by dividing total spending on ads by the number of units sold.
- Earning Per Leads/Click
Purchase Conversion value divided by the number of clicks is the Earning Per Click.
- Cost Per Lead
Cost per lead is how much you spend on ads divided by the number of leads or clicks you receive.
- Clickthrough Rate
The clickthrough rate is an indicator of how engaging your ad is to the audience. A rate of above 1.5 is sought-after. Some view clickthrough rate as engagement/impression.
Now it’s time for you to do more googling on the Facebook Metrics above. Read on.
#4th Tips: The 3 useful reports
To make analysis easier, there are 3 customs report that you can refer to which the main purpose is to
- Generate sales report
- Check out the lead generation
- Evaluate the engagement rate
1. ROI snapshot – sales report (only for conversion objective campaigns, purchase conversion, lead generation)
- -Results
- -Cost per Results
- -Amount Spent
- -Checkout initiated (untick)
- -Cost per checkouts initiated
- -Website purchases
- – Cost per Purchases
- -Purchases Conversion Value (untick)
- – Total Purchases ROAS (untick)
2. Lead Progress Report- lead cost
- -Results
- -Cost per result
- -Amount spent
- -Link Clicks
- -CPC
- -CTR
- -Checkout initiated
- -Cost per checkouts initiated
- -Website purchases
- – Cost per Purchases
- -Purchases Conversion Value
- – Total Purchases ROAS
3.Engagement report- how engaging the ads are
- -Results
- -Cost per Result
- -Amount Spent
- -Link clicks
- -CPC
- -CTR
- -Under the engagement page post, click post comments, post engagement, post reactions, post saves, and post shares.
- -Cost per page engagement
- -2 secs continuous video views
- -10 secs video views
- -Video watches at 50%, 75%, 95%, 100%
- -Video average watch time
What are you waiting for? Kickstart your own customised report to uncover insights that will grow your business. For any further questions, click HERE—we’ll be more than happy to assist you.


